Earliest cases of COVID-19 traced to market in Wuhan, China

Original story at U of U Health.

An international team of 18 researchers, including a scientist at University of Utah Health, have determined that the earliest cases of COVID-19 in humans arose at a wholesale fish market in Wuhan, China, in December 2019. They linked these cases to bats, foxes and other live mammals infected with the virus sold in the market either for consumption as meat or for their fur.

The finding, published in the July 26, 2022, issue of Science, aligns with early reports, later dismissed by senior Chinese officials, that live animals sold at the Huanan Seafood Wholesale Market were the likely source of the pandemic that has claimed at least 6.4 million lives since it first emerged in China nearly three years ago.

“These are the most compelling and most detailed studies of what happened in Wuhan in the earliest stages of what would become the COVID-19 pandemic,” says Stephen Goldstein, Ph.D., a co-author of the study led by senior author Kristian Anderson, Ph.D., from the Scripps Research Institute in La Jolla and first author Michael Worobey, Ph.D., from the University of Arizona. Goldstein is a postdoctoral scientist in the department of Human Genetics at U of U Health. “We have convincingly shown that the wild animal sales at the Huanan Market in Wuhan are implicated in the first human cases of the disease.”

Among the study’s key findings:

  • The emergence of SARS-CoV-2, the virus that causes COVID-19, can likely be traced to one or more of the 10 to 15 stalls in the market that sold rats, porcupines, badgers, hares, foxes, hedgehogs, marmots, and Chinese muntjac (a small deer). Health officials and researchers detected SARS-CoV-2 on animal cages, carts, and drainage grates in these venues.
  • The only areas where the virus was spreading in December 2019 were in neighborhoods within a half-mile of the market. Previously, some researchers had suggested that the virus was brought into the market from elsewhere in the city and spread among its patrons. Instead, the new findings strongly suggest that the virus originated in the market via live animal sales, and slowly spreading from there into nearby neighborhoods and then the city at large.
  • Two variants of the SARS-CoV-2 virus were detected at the market. That suggests both variants originated independently at the market and helps confirm the researchers’ hypothesis that early spread of the infection began there. If the virus originated elsewhere, it’s more likely that only a single variant would have been found.

The researchers say that moving forward, public officials should seek better understanding of the wildlife trade in China and elsewhere and promote more comprehensive testing of live animals sold in markets to lower the risk of future pandemics.

In a press conference, Stephen Goldstein, PhD, explains and answers questions about the study.

####

The research published as “The Huanan Seafood Wholesale Market in Wuhan Was the Early Epicenter of the COVID-19 Pandemic” in Science on July 26, 2022.
 

Will COVID-19 become a seasonal nuisance?

Within the next decade, the novel coronavirus responsible for COVID-19 could become little more than a nuisance, causing no more than common cold-like coughs and sniffles. That possible future is predicted by mathematical models that incorporate lessons learned from the current pandemic on how our body’s immunity changes over time. Scientists at the University of Utah carried out the research, now published in the journal Viruses.

“This shows a possible future that has not yet been fully addressed,” says Fred Adler, professor of mathematics and biological sciences at the U. “Over the next decade, the severity of COVID-19 may decrease as populations collectively develop immunity.”

The findings suggest that changes in the disease could be driven by adaptations of our immune response rather than by changes in the virus itself. Adler was senior author on the publication with Alexander Beams, first author and graduate student in the Department of Mathematics and the Division of Epidemiology at University of Utah Health, and undergraduate co-author Rebecca Bateman.

Although SARS-CoV-2 (the sometimes-deadly coronavirus causing COVID-19) is the best-known member of that virus family, other seasonal coronaviruses circulate in the human population—and they are much more benign. Some evidence indicates that one of these cold-causing relatives might have once been severe, giving rise to the “Russian flu” pandemic in the late 19th century. The parallels led the U of U scientists to wonder whether the severity of SARS-CoV-2 could similarly lessen over time.

To test the idea, they built mathematical models incorporating evidence on the body’s immune response to SARS-CoV-2 based on the following data from the current pandemic.

  • There is likely a dose response between virus exposure and disease severity.
  • A person exposed to a small dose of virus will be more likely to get a mild case of COVID-19 and shed small amounts of virus.
  • By contrast, adults exposed to a large dose of virus are more likely to have severe disease and shed more virus.
  • Masking and social distancing decrease the viral dose.
  • Children are unlikely to develop severe disease.
  • Adults who have had COVID-19 or have been vaccinated are protected against severe disease.

Running several versions of these scenarios showed that the three mechanisms in combination set up a situation where an increasing proportion of the population will become predisposed for mild disease over the long term. The scientists felt the transformation was significant enough that it needed a new term. In this scenario, SARS-CoV-2 would become “Just Another Seasonal Coronavirus,” or JASC for short.

“In the beginning of the pandemic, no one had seen the virus before,” Adler explains. “Our immune system was not prepared.” The models show that as more adults become partially immune, whether through prior infection or vaccination, severe infections all but disappear over the next decade. Eventually, the only people who will be exposed to the virus for the first time will be children—and they’re naturally less prone to severe disease.

“The novel approach here is to recognize the competition taking place between mild and severe COVID-19 infections and ask which type will get to persist in the long run,” Beams says. “We’ve shown that mild infections will win, as long as they train our immune systems to fight against severe infections.”

The models do not account for every potential influence on disease trajectory. For example, if new virus variants overcome partial immunity, COVID-19 could take a turn for the worse. In addition, the predictions rely on the key assumptions of the model holding up.

“Our next step is comparing our model predictions with the most current disease data to assess which way the pandemic is going as it is happening,” Adler says. “Do things look like they’re heading in a bad or good direction? Is the proportion of mild cases increasing? Knowing that might affect decisions we make as a society.”

The research, published as “Will SARS-CoV-2 Become Just Another Seasonal Coronavirus?”, was supported by COVID MIND 2020 and a seed grant from the University of Utah Vice President for Research and the Immunology, Inflammation and Infectious Diseases Initiative.

Most COVID-19 maps fail to improve public understanding of pandemic

Since COVID-19 first arose as a worldwide health threat, millions of websites with maps charting the spread and prevalence of the virus have appeared on the internet. However, most of these maps do not improve public understanding of the potential risk of contracting COVID-19 or promote compliance with health guidelines meant to slow its spread, according to a new study led by University of Utah Health scientists in collaboration with other institutions.

In fact, the researchers found that study participants who didn’t see a map were more knowledgeable about the total number of COVID-19 cases in the United States than those who viewed one. They also found that maps did not influence a person’s perception of their own risk of contracting the disease.

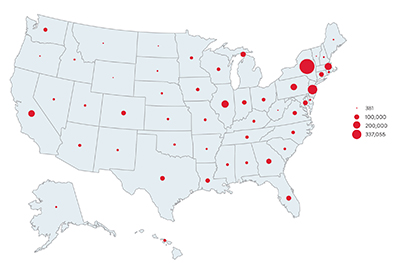
A map of the U.S. with red circles that represent COVID-19 outbreaks.

Most COVID-19 maps, such as this bubble map, fail to improve public understanding of the pandemic and its risks.

“We know that people’s behavior and intentions are influenced by how well informed they are and how they perceive risk,” says Alistair Thorpe, lead author of the study and a U of U Health postdoctoral research fellow. “Prevalence maps are designed to help with that and so many have appeared during the COVID-19 pandemic. However, we found that simply presenting COVID-19 information in a map doesn’t necessarily have the intended influence on knowledge, perception, or behavior.”

The study appears in JAMA Network Open.

In a May 2020 online survey, the researchers asked 2,676 people, aged 18 to 91, to view one of six randomly selected maps of COVID-19 prevalence in the United States. Then, they were questioned about their knowledge of confirmed COVID-19 cases, their perceived risk of getting the disease, and whether they intended to adhere to COVID-19 prevention guidelines. A control group was not shown any of the maps and was simply asked to answer the questions based on their own knowledge without visual aids.

“The goal of this study was to try to find the best method for having people understand how common COVID-19 is nationwide as well as where they live,” says Angela Fagerlin, senior author of the paper, a U of U Health professor of population health sciences, and a research scientist at the Veterans Affairs Salt Lake City Health Care System. “We were hoping that understanding the prevalence of this disease would inspire them to take action to prevent the spread of COVID-19.”

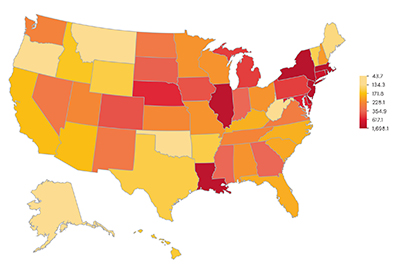
A map of the U.S. where states are colored on a gradient from light beige to red to represent COVID-19 outbreak densities.

Heat maps, such as this one, that display COVID-19 cases per capita by state appear to be more effective than others.

Overall, those who saw maps were no more knowledgeable about the COVID-19 pandemic than those who didn’t see them. Participants who saw a map had lower perceptions of the risk to society; they were also more optimistic that the pandemic would be better in two weeks compared to those who didn’t see a map. None of the maps appeared to influence how participants perceived their personal susceptibility to the virus or whether they intended to follow public health guidelines.

However, heat maps that depicted per capita cases by state in varying hues and intensities depending on localized prevalence appeared to be more effective than others.

“The features of these maps appear to be the most effective for improving or at least maintaining public knowledge of COVID-19 cases,” Thorpe says.

Among the study’s limitations are its reliance on self-reported information and potential barriers to participation, including lower English proficiency and limited or no internet access.

Moving forward, the researchers believe this finding could have significant long-term implications.

“There’s a lot of data coming out during this outbreak about how to effectively communicate health information that will help us in the next pandemic,” Fagerlin says. “I hope we can learn from this experience so we don’t have to recreate the wheel every time we experience a pandemic.”

Find original post here.

First daily surveillance of emerging COVID-19 hot spots

Over the course of the coronavirus epidemic, COVID-19 outbreaks have hit communities across the United States. As clusters of infection shift over time, local officials are forced into a whack-a-mole approach to allocating resources and enacting public health policies. In a new study led by the University of Utah, geographers published the first effort to conduct daily surveillance of emerging COVID-19 hotspots for every county in the contiguous U.S. The researchers hope that timely, localized data will help inform future decisions.

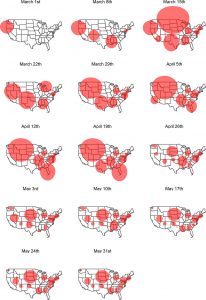
Using innovative space-time statistics, the researchers detected geographic areas where the population had an elevated risk of contracting the virus. They ran the analysis every day using daily COVID-19 case counts from Jan. 22 to June 5, 2020 to establish regional clusters, defined as a collection of disease cases closely grouped in time and space. For the first month, the clusters were very large, especially in the Midwest. Starting on April 25, the clusters become smaller and more numerous, a trend that persists until the end of the study.

The article published online on June 27, 2020, in the journal Spatial and Spatio-temporal Epidemiology. The study builds on the team’s previous work by evaluating the characteristics of each cluster and how the characteristics change as the pandemic unfolds.

Weekly clusters resulting from the prospective space-time scan statistic.

“We applied a clustering method that identifies areas of concern, and also tracks characteristics of the clusters—are they growing or shrinking, what is the population density like, is relative risk increasing or not?” said Alexander Hohl, lead author and assistant professor at the Department of Geography at the U. “We hope this can offer insights into the best strategies for controlling the spread of COVID-19, and to potentially predict future hotspots.”

The research team, including Michael Desjardins of Johns Hopkins Bloomberg School of Public Health’s Spatial Science for Public Health Center and Eric Delmelle and Yu Lan of the University of North Carolina at Charlotte, have created a web application of the clusters that the public can check daily at COVID19scan.net. The app is just a start, Hohl warned. State officials would need to do smaller scale analysis to identify specific locations for intervention.

“The app is meant to show where officials should prioritize efforts—it’s not telling you where you will or will not contract the virus,” Hohl said. “I see this more as an inspiration, rather than a concrete tool, to guide authorities to prevent or respond to outbreaks. It also gives the public a way to see what we’re doing.”

The researchers used daily case counts reported in the COVID-19 Data Repository from the Center for Systems Science and Engineering at Johns Hopkins University, which lists cases at the county level in the contiguous U.S. They used the U.S. Census website’s 2018 five-year population estimates within each county.

To establish the clusters, they ran a space-time scan statistic that takes into account the observed number of cases and the underlying population within a given geographic area and timespan. Using SatScan, a widely used software, they identified areas of significantly elevated risk of COVID-19. Due to the large variation between counties, evaluating risk is tricky. Rural areas and small, single counties may not have large populations, therefore just a handful of cases would make risk go up significantly.

This study is the third of the research group’s iteration using the statistical method for detecting and monitoring COVID-19 clusters in the U.S. Back in May, the group published their first geographical study to use the tracking method, which was also of the first paper published by geographers analyzing COVID-19. In June, they published an update.

“May seems like an eternity ago because the pandemic is changing so rapidly,” Hohl said. “We continue to get feedback from the research community and are always trying to make the method better. This is just one method to zero in on communities that are at risk.”

A big limitation of the analysis is the data itself. COVID-19 reporting is different for each state. There’s no uniform way that information flows from the labs that confirm the diagnoses, to the state health agencies to the COVID-19 Data Repository from the Center for Systems Science and Engineering at Johns Hopkins University, where the study gets its data. Also, the testing efforts are quite different between states, and the team is working to adjust the number of observed cases to reflect a state’s efforts. Hohl is also working with other U researchers to look at the relationship between social media and COVID-19 to predict the future trajectory of outbreaks.

“We’ve been working on this since COVID-19 first started and the field is moving incredibly fast,” said Hohl. “It’s so important to get the word out and react to what else is being published so we can take the next step in the project.”

Find the original post here.